Are you working with MATLAB figures and need to change the color of two lines to make your data stand out? Whether you’re preparing a presentation or just want your plots to look cleaner and more professional, knowing how to customize line colors can make a big difference.
In this guide, you’ll learn simple and effective ways to change the color of two lines in your MATLAB figure quickly. By the end, you’ll have the confidence to control your plot’s appearance exactly the way you want it. Ready to make your MATLAB figures more vibrant and clear?
Let’s dive in!
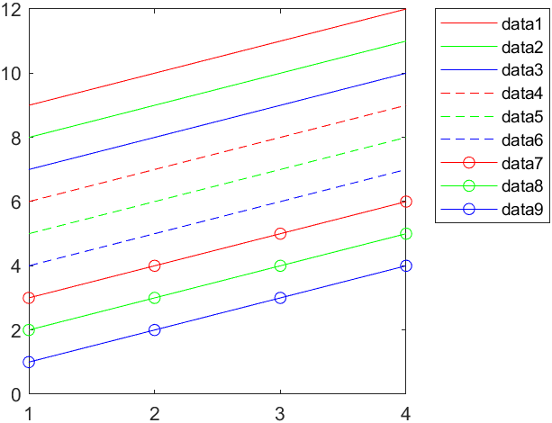
Credit: www.mathworks.com
Plotting Two Lines In Matlab
Plotting two lines in Matlab is a common task for data visualization. It helps compare different data sets clearly. Matlab offers simple commands to create multiple lines on the same graph. This section explains how to plot two lines step-by-step.
Start by preparing your data points. Use vectors or arrays to hold the x and y values. Then use the plot function to draw the first line. To add the second line, call plot again and use hold on to keep the first line visible.
Preparing Data For Two Lines
Create two sets of x and y values. For example, x = 1:10; and y1 = x.^2; for the first line. For the second line, use y2 = x.^3;. These will generate two different curves to plot.
Using The Plot Function
Plot the first line with plot(x, y1). Then add hold on to keep the plot active. Next, plot the second line using plot(x, y2). Both lines will appear on the same graph.
Customizing Line Colors
Matlab assigns default colors to lines automatically. To change colors, specify the color inside the plot command. For example, plot(x, y1, 'r') makes the first line red. Use plot(x, y2, 'b') to make the second line blue.
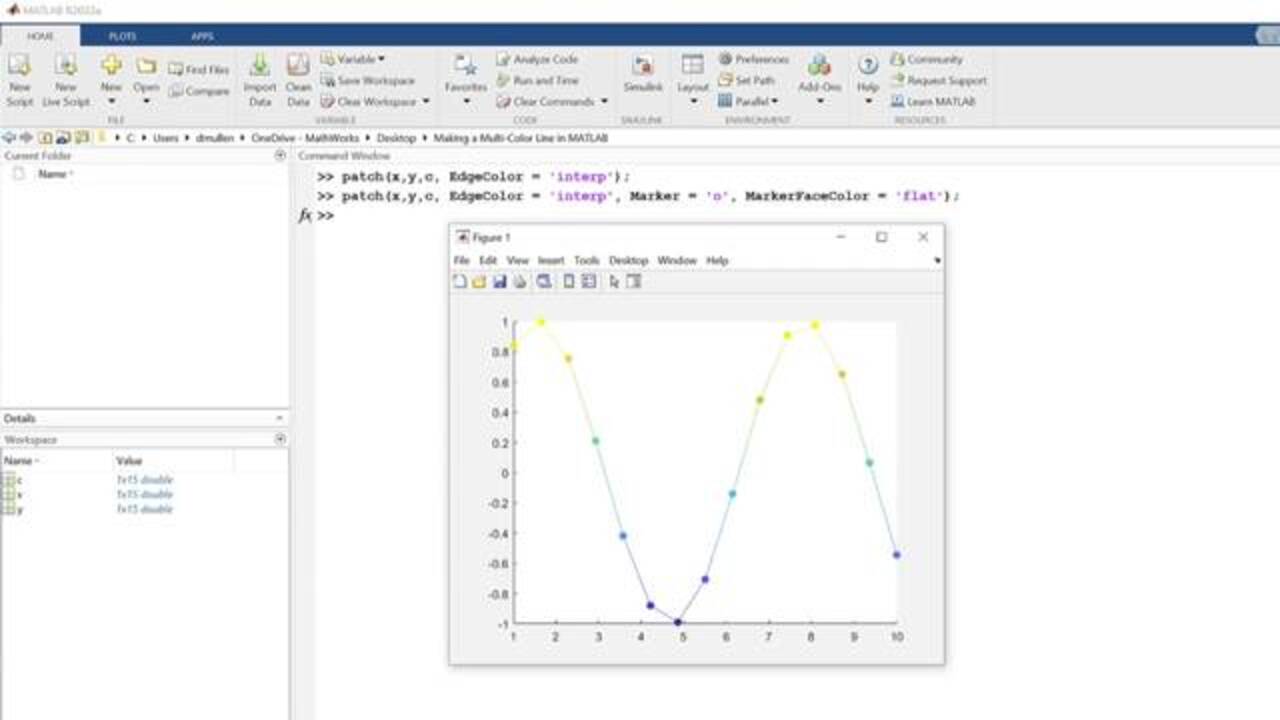
Credit: www.mathworks.com
Default Line Colors
In MATLAB, plots automatically use default line colors. These colors help distinguish multiple lines in a figure. Understanding these defaults is key before changing line colors manually.
MATLAB cycles through a set of colors when plotting multiple lines. This cycle repeats if there are more lines than colors. Knowing the order helps predict which colors appear by default.
Default Color Order In Matlab
The default color order includes seven colors. They are blue, orange, yellow, purple, green, light blue, and red. Each new plot line uses the next color in this sequence.
How Matlab Applies Default Colors
When you use the plot function with multiple lines, MATLAB assigns colors automatically. The first line is blue, the second orange, and so on. This automatic assignment simplifies quick plotting.
Limitations Of Default Colors
The default colors may not always suit your needs. Sometimes colors are too similar or not clear enough. Changing colors manually can improve plot readability and presentation.
Using Colorspec For Lines
Using ColorSpec in MATLAB helps you easily change the color of lines in your plot. ColorSpec allows specifying colors by name, short name, or RGB values. This flexibility makes your plots clear and visually appealing.
ColorSpec works with the plot function to define the color of each line. You can set colors directly when creating the plot or change them afterward using line properties. This method is simple and effective for customizing multiple lines.
What Is Colorspec In Matlab?
ColorSpec is a way to define colors in MATLAB using names or codes. You can use color names like ‘red’, ‘blue’, or ‘green’. Also, single-letter shortcuts like ‘r’, ‘b’, or ‘g’ work for common colors. For more control, RGB triplets let you set custom colors.
Changing Line Colors Using Colorspec
To change line colors, use the plot command with ColorSpec arguments. For example, plot(x, y1, ‘r’) draws the first line in red. To add a second line in blue, use plot(x, y2, ‘b’). This changes the color quickly without extra code.
Using Rgb Triplets For Custom Colors
RGB triplets let you specify colors by three numbers between 0 and 1. For example, [0.5 0.2 0.8] creates a purple shade. Use this by setting the ‘Color’ property after plotting. This way, you create unique colors not available by name.
Setting Custom Rgb Colors
Setting custom RGB colors in MATLAB allows precise control over your plot’s appearance. You can define exact shades for your lines, enhancing clarity and style. RGB colors use three values between 0 and 1, representing red, green, and blue intensities. This method surpasses basic color names and provides flexibility for your graphs.
Using custom RGB colors is straightforward. You assign an RGB triplet to the ‘Color’ property of a plot line. This technique applies to multiple lines, letting you highlight each with unique colors. It improves visual distinction, especially when plotting more than one line.
Understanding Rgb Color Values
RGB colors consist of three numbers. Each number ranges from 0 to 1. The first is red, the second green, and the third blue. For example, pure red is [1 0 0], pure green is [0 1 0], and pure blue is [0 0 1]. Mixing these values produces many colors. MATLAB reads these triplets to color your plot lines.
Applying Rgb Colors To Lines In Matlab
Create your plot using the plot function. Save the plot handles for each line. Use the set function to change each line’s color. For example, set(line1, ‘Color’, [0.5 0 0.5]) changes the first line to purple. Similarly, set(line2, ‘Color’, [0 0.75 0]) changes the second line to a dark green. This method keeps your code clear and editable.
Example Code For Two Custom Colored Lines
x = 1:10; y1 = sin(x); y2 = cos(x); h1 = plot(x, y1); hold on; h2 = plot(x, y2); set(h1, 'Color', [0.8 0.1 0.1]); % Custom red set(h2, 'Color', [0.1 0.3 0.7]); % Custom blue hold off;This code draws two lines with custom colors. The first line uses a bright red. The second line uses a soft blue. Adjust the RGB values to fit your preferred colors.
Changing Color Via Line Properties
Changing the color of lines in a MATLAB figure improves visual clarity. It helps to distinguish data sets easily. You can change colors by modifying line properties directly in MATLAB.
This method gives precise control over each line’s appearance. It works well for figures with two or more lines. The Color property is key to this process.
Accessing Line Objects In Matlab
First, create your plot using the plot function. It returns line object handles that represent each line. Store these handles in a variable for easy access.
For example, use h = plot(x, y1, x, y2);. Here, h(1) is the first line and h(2) is the second line. These handles allow you to change each line’s properties.
Modifying The Color Property
To change a line’s color, set its Color property. Use RGB triplets or predefined color names. For instance, h(1).Color = [1 0 0]; sets the first line to red.
Similarly, h(2).Color = 'b'; changes the second line to blue. Use simple color codes or customize with RGB values for unique colors.
Using Rgb Values For Custom Colors
RGB values range from 0 to 1 for red, green, and blue components. Example: [0 0.5 0] creates a dark green color. Assign this to the line’s Color property for a custom look.
Custom colors enhance figure readability and help match presentation themes. Adjust colors easily by changing the RGB values in your code.
Modifying Colors In Existing Figures
Modifying colors in existing MATLAB figures helps you highlight data clearly. It makes your plots easier to read and understand. Changing line colors after creating a plot is simple and fast.
You do not need to redraw the entire figure. MATLAB allows you to access and change properties of lines already plotted. This flexibility lets you adjust visuals to your needs.
Accessing Line Objects In A Figure
First, open your MATLAB figure or plot window. Use the findobj function to get handles to the lines. For example, lines = findobj(gca, 'Type', 'line'); finds all line objects.
These handles let you change properties like color, style, and width. You can then modify each line separately by indexing the handle array.
Changing Line Colors Using Handles
After getting the line handles, set the color using the Color property. Use RGB triplets or color names. For example, lines(1).Color = [1 0 0]; changes the first line to red.
Similarly, change the second line with lines(2).Color = [0 0 1]; for blue. This method works for any number of lines in your figure.
Using The Figure Toolbar For Quick Color Changes
You can also change line colors directly from the figure window. Click the cursor icon, then click a line to select it. Right-click and pick “Color” to choose a new color.
This option is user-friendly and requires no coding. It is perfect for quick adjustments and visual testing.
Using Colororder For Multiple Lines
Using ColorOrder in MATLAB helps manage line colors automatically. It assigns colors to multiple lines in a plot without manual changes. This method is useful for plots with several lines, keeping colors consistent and clear.
By setting the ColorOrder property, you control the sequence of colors MATLAB uses. This makes it easier to distinguish lines in complex figures.
What Is Colororder In Matlab?
ColorOrder is a property of axes that defines the colors used for plot lines. MATLAB cycles through these colors for each new line. It helps keep your plots colorful and organized.
How To Set Colororder For Two Lines
Use the command set(gca, 'ColorOrder', colors, 'NextPlot', 'replacechildren'). Replace colors with an array of RGB values. This sets the color sequence for your lines.
For example, to set the first line red and the second blue, define colors = [1 0 0; 0 0 1];.
Example Code Using Colororder
colors = [1 0 0; 0 0 1]; % Red and Blue set(gca, 'ColorOrder', colors, 'NextPlot', 'replacechildren'); plot(x, y1, x, y2); This code plots two lines with red and blue colors automatically. It avoids manual color setting for each line.
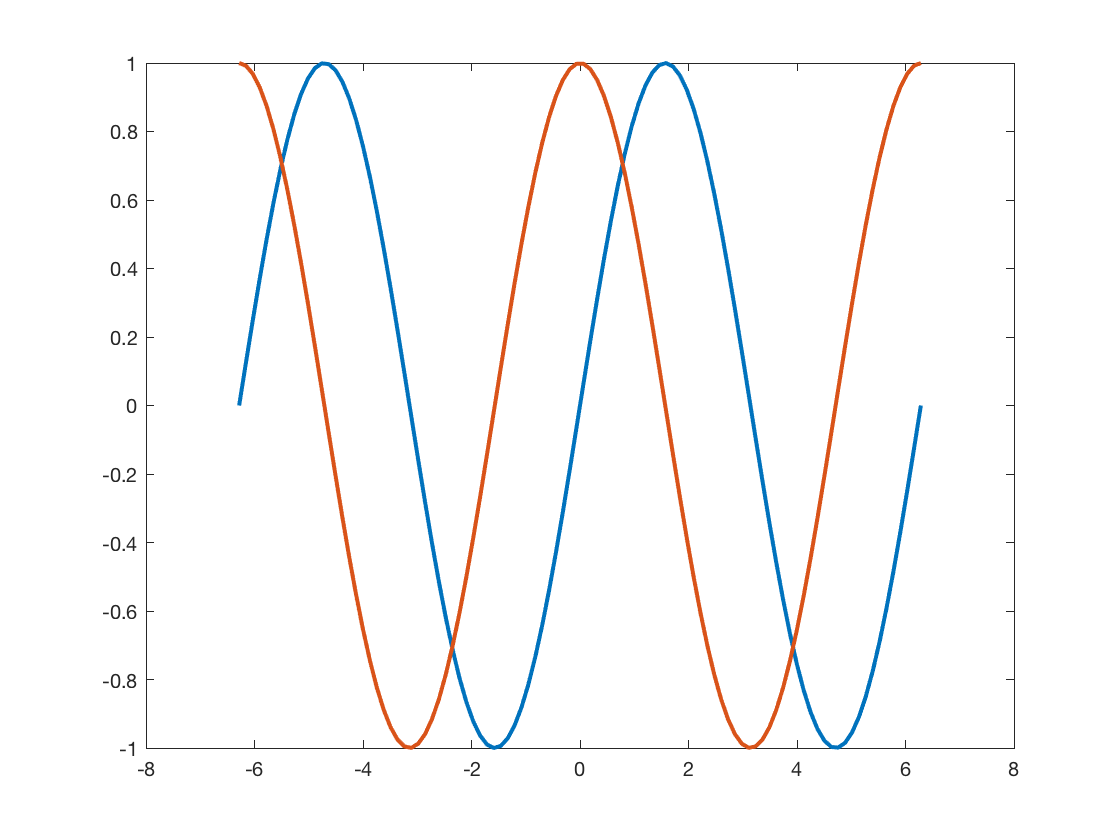
Credit: blogs.mathworks.com
Applying Colors To Scatter And Dotted Lines
Changing colors of scatter and dotted lines in Matlab is simple. Use the ‘Color’ property to set each line’s color. This helps distinguish multiple lines clearly in your figure.
Changing the color of scatter and dotted lines in a MATLAB figure helps highlight data clearly. Color distinguishes different data sets and improves the figure’s visual appeal. MATLAB allows easy customization of these line styles with simple commands.
Scatter plots use markers to show individual points, while dotted lines connect these points with a dashed pattern. Coloring these elements separately makes the graph easier to read and understand.
Changing Scatter Plot Colors
To change scatter plot colors, use the ‘scatter’ function with color arguments. Specify the color using a named color or RGB values. For example, scatter(x, y, 'r') creates red markers. RGB codes like [0 0.5 0] produce custom greens.
Adjust marker size and type to enhance visibility. Use the ‘MarkerEdgeColor’ and ‘MarkerFaceColor’ properties for more control over the scatter points’ colors.
Customizing Dotted Line Colors
For dotted lines, use the ‘plot’ function with a line style argument. For instance, plot(x, y, ':', 'Color', 'b') plots a blue dotted line. The colon symbol ':' sets the dotted style.
You can use RGB triplets to pick unique colors. This method offers flexibility beyond standard color names. Adjust line width for better visibility with the ‘LineWidth’ property.
Combining Scatter And Dotted Lines With Different Colors
Plot scatter points and dotted lines separately to assign different colors. First, plot the dotted line with one color. Then, add scatter points with another color on top. This layering makes both elements stand out clearly.
Use the hold on command to keep the figure active while adding multiple plots. This approach helps maintain the color settings for each plot element.
Tips For Color Selection And Visibility
Choosing the right colors for your MATLAB figure lines helps viewers understand your data clearly. Good color choices improve visibility and make the plot easy to read. This is very important when showing two lines on the same graph. Use colors that stand out from each other and the background. Keep the colors simple and easy to see.
Use High Contrast Colors
Pick colors that differ a lot in brightness and shade. For example, pair dark blue with bright orange. This contrast makes each line easy to spot. Avoid colors that look similar, like red and dark pink. They can confuse viewers and hide important details.
Consider Color Blindness
Many people have trouble seeing red and green. Choose colors safe for color-blind viewers. Blue and orange or blue and yellow are good choices. Use tools or websites to check if your colors are color-blind friendly.
Match Colors To Your Data
Use colors that fit the data story. For example, use red for high values and blue for low values. This helps readers understand the meaning behind each line. Keep the colors consistent if you create multiple plots.
Test Colors On Different Backgrounds
Check how your colors look on light and dark backgrounds. Some colors may disappear or look dull. Adjust brightness or switch colors to keep lines visible. This is important if you plan to print your figures or share them online.
Troubleshooting Common Color Issues
Changing the color of two lines in a MATLAB figure can sometimes be tricky. Common color problems may arise even after applying the correct commands. Troubleshooting these issues helps save time and achieve the desired plot appearance.
Understanding why colors do not change as expected is crucial. Some errors come from syntax mistakes or property conflicts. This section covers the most frequent color issues and how to fix them quickly.
Incorrect Syntax In Color Specification
Using the wrong syntax for color settings is a top cause of errors. MATLAB expects colors as short names like ‘r’ for red or RGB triplets like [1 0 0]. Mixing these formats or misspelling color names causes no color change.
Always check that the color input matches MATLAB’s requirements. For example, use plot(x, y, ‘Color’, [0 0 1]) for blue lines. Avoid extra spaces or wrong brackets.
Overlapping Line Handles
When plotting multiple lines, each line has a handle. Changing color must target the correct handle. If you change the color of the wrong handle, the visible line color stays the same.
Store each plot command’s output in a variable. Then set the ‘Color’ property for each handle separately. This method avoids confusion and ensures each line updates.
Figure Property Conflicts
Figure or axes properties can override line colors. For example, the ‘ColorOrder’ property may reset line colors automatically. This setting conflicts with manual color changes.
Check for such properties and disable automatic coloring when needed. Use commands like set(gca, ‘ColorOrder’, []) to clear default colors. Then apply manual colors without interference.
Using Unsupported Color Values
MATLAB accepts colors as RGB triplets within 0 to 1 range. Values outside this range cause errors or no color change. Integer values like 255 must be scaled down to decimals.
Convert any 0-255 color codes by dividing by 255. For example, [128 0 128] becomes [0.5 0 0.5]. Always verify color values before applying them.
Plot Refresh Issues
Sometimes, MATLAB does not refresh the plot after changing color properties. The figure window may show old colors despite code execution.
Call the drawnow command after setting colors. This forces MATLAB to update the figure. Alternatively, use refreshdata to reload plot data and colors.
Frequently Asked Questions
How To Change The Color Of Lines In Matlab?
Change line colors in MATLAB by setting the ‘Color’ property in the plot command. Use RGB values or named colors. Example: plot(x, y, ‘Color’, [1 0 0]) for red. Alternatively, click the line in the figure, right-click, select Color, and choose a new color.
How To Change The Color Of A Figure In Matlab?
To change a figure’s color in MATLAB, select the plot, right-click, choose “Color,” pick a new color, and click “OK. “
How To Make Each Bar A Different Color In Matlab?
Create a bar chart using bh = bar(data); then set colors with bh. CData = [colors]; where colors is an Nx3 RGB matrix.
How To Change Contour Lines Color In Matlab?
Use the ‘Color’ property in the contour function to set contour line colors. Example: contour(X,Y,Z,’LineColor’,’red’). For multiple colors, use ‘EdgeColor’,’flat’ and a colormap. Adjust colormap limits to control color mapping.
How To Change The Color Of Two Lines In Matlab Figure?
Use the plot command with ‘Color’ property for each line to set their colors individually.
Can I Use Rgb Values To Color Matlab Plot Lines?
Yes, specify RGB triplets like [1 0 0] for red in the ‘Color’ property.
How To Change Line Colors After Plotting In Matlab?
Get line handles and set their ‘Color’ property to new RGB or color names.
What Are Common Color Names For Matlab Plot Lines?
Colors like ‘r’ (red), ‘g’ (green), ‘b’ (blue), ‘k’ (black) are commonly used.
How To Plot Two Lines With Different Colors In One Command?
Use two plot commands or plot multiple lines and specify colors using the ‘Color’ array.
Can I Change Line Colors Using The Matlab Figure Gui?
Yes, click the line in the figure, right-click, choose Color, and pick a new color.
Conclusion
Changing the color of two lines in a MATLAB figure is simple and quick. Use the Color property to set your desired colors. This helps make your plots clearer and more visually appealing. Experiment with different colors to highlight important data.
With these steps, your MATLAB plots will look more professional and easier to understand. Keep practicing to get comfortable with MATLAB plotting options.